It's Monday morning. Your weekend deployment is being rolled back because a critical test is failing in production that previously passed perfectly in staging. The test works on your machine. It worked on your colleague's machine. But somewhere between your local environment and the CI runner, something went wrong.
You add console.log statements. You increase timeouts. You run the test 50 times locally, hoping to catch it failing just once. Hours pass. You're debugging blind.
This scenario plays out thousands of times daily across engineering teams worldwide. The fundamental problem? Traditional testing gives you a binary result (pass/fail) from a complex, multi-dimensional execution. It's like receiving a "no" to a marriage proposal via text, with no context, explanation, or ability to understand what went wrong.
The Playwright Trace Viewer completely changes this paradigm. Instead of a snapshot of failure, you get a complete recording of everything that happened during your test. Every network request, every DOM mutation, every millisecond of execution is captured in a forensic-quality record that you can analyze offline, share with teammates, and use to debug with surgical precision.
This guide will transform you from someone who fears test failures to someone who welcomes them as opportunities for learning. By the end, you'll not only fix bugs faster, but you'll understand your application's behavior at a level previously impossible.
What Makes Playwright Traces So Powerful?
When you enable tracing, Playwright captures everything at multiple levels:
- Protocol Level: Every interaction between your test and the browser
- Network Layer: All HTTP traffic with headers and payloads
- DOM Snapshots: Complete DOM state before and after each action
- Console Output: Every log, warning, and error
- Source Mapping: Direct links from actions to your test code
All compressed into a single .zip file (typically 1-50MB) that you can open, share, and analyze anywhere.
How Do You Set Up Complete Tracing From Zero?
What's the Initial Trace Viewer Configuration?
Start with the recommended configuration that balances information capture with performance:
Which Trace Mode Should You Use?
Each trace mode serves a specific purpose:
- 'off': No tracing (for production smoke tests)
- 'on': Always trace (for new test development, can generate 1GB+ for large suites)
- 'retain-on-failure': The sweet spot for CI/CD (minimal overhead for passing tests)
- 'on-first-retry': Smart for flaky tests (skips first run, captures retry)
How Do You Enable Debugging with Programmatic Tracing?
Sometimes you need to trace a specific section of a complex test:
How Can You Automate Trace Analysis?
For teams serious about quality, automate trace analysis to catch issues early:
This helps you proactively identify performance regressions and bloated traces before they become problems.
How Do You Understand the Trace Viewer Interface?
When you open a trace, either locally with npx playwright show-trace or at trace.playwright.dev , you're greeted with the debugging interface. Let's walk through a real debugging session with a TODO app test .
Following the Test Story Through Actions
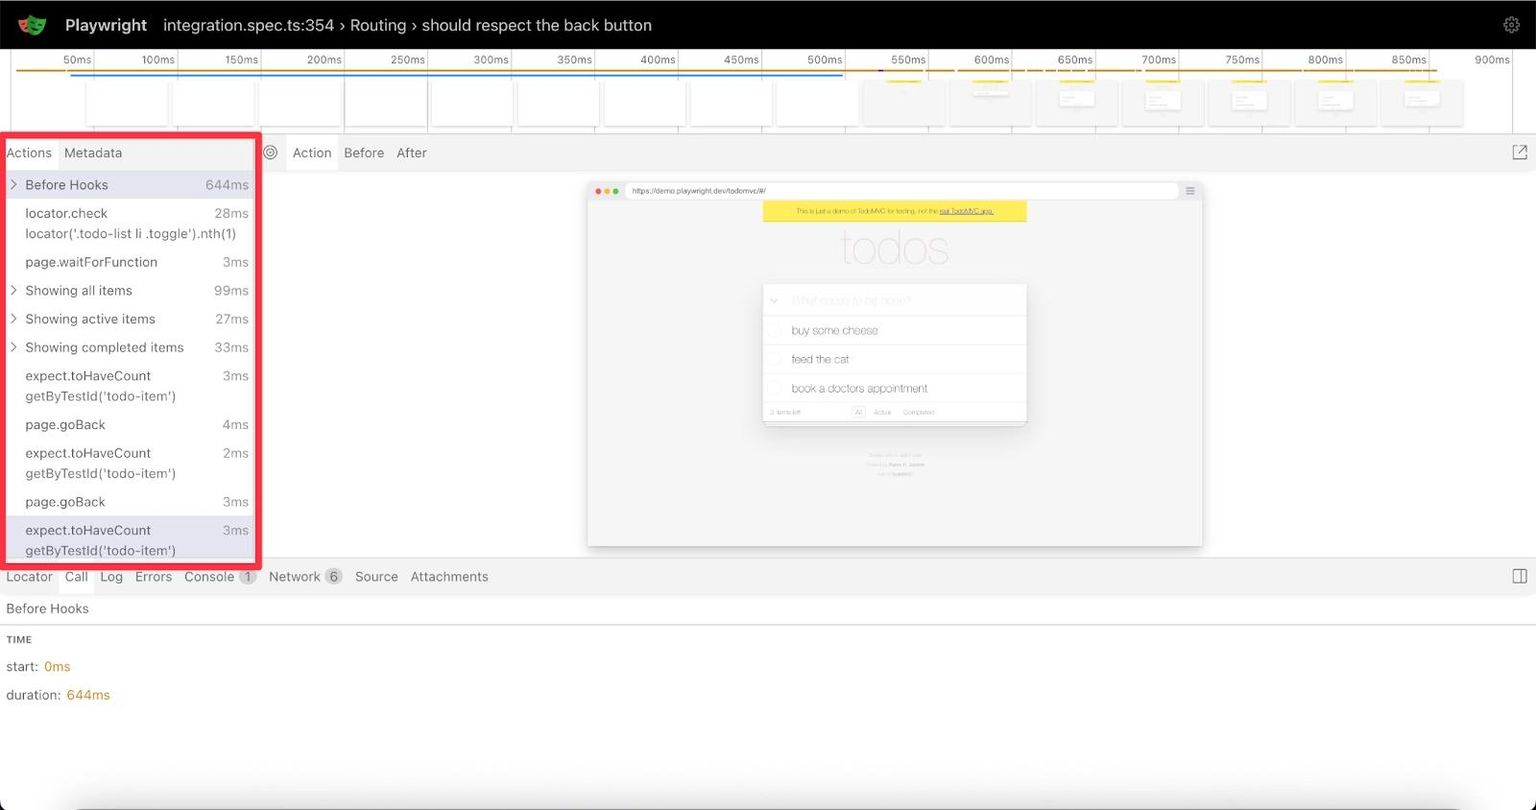
The left sidebar reveals the complete story of your test. In our TODO app example, "Before Hooks" dominates at 644ms - nearly two-thirds of the total test time.
Click through the actions: locator.check (28ms) checks a TODO item. Then page.waitForFunction (3ms) waits for the UI to update. The highlighted "Showing all items" (99ms) is where we are now. That duration suggests an API call is being made behind the scenes.
Each action is a breadcrumb. "Showing active items" (27ms), "Showing completed items" (33ms) - The test cycles through the TODO filters, testing each view.
Decoding Performance Patterns in the Timeline
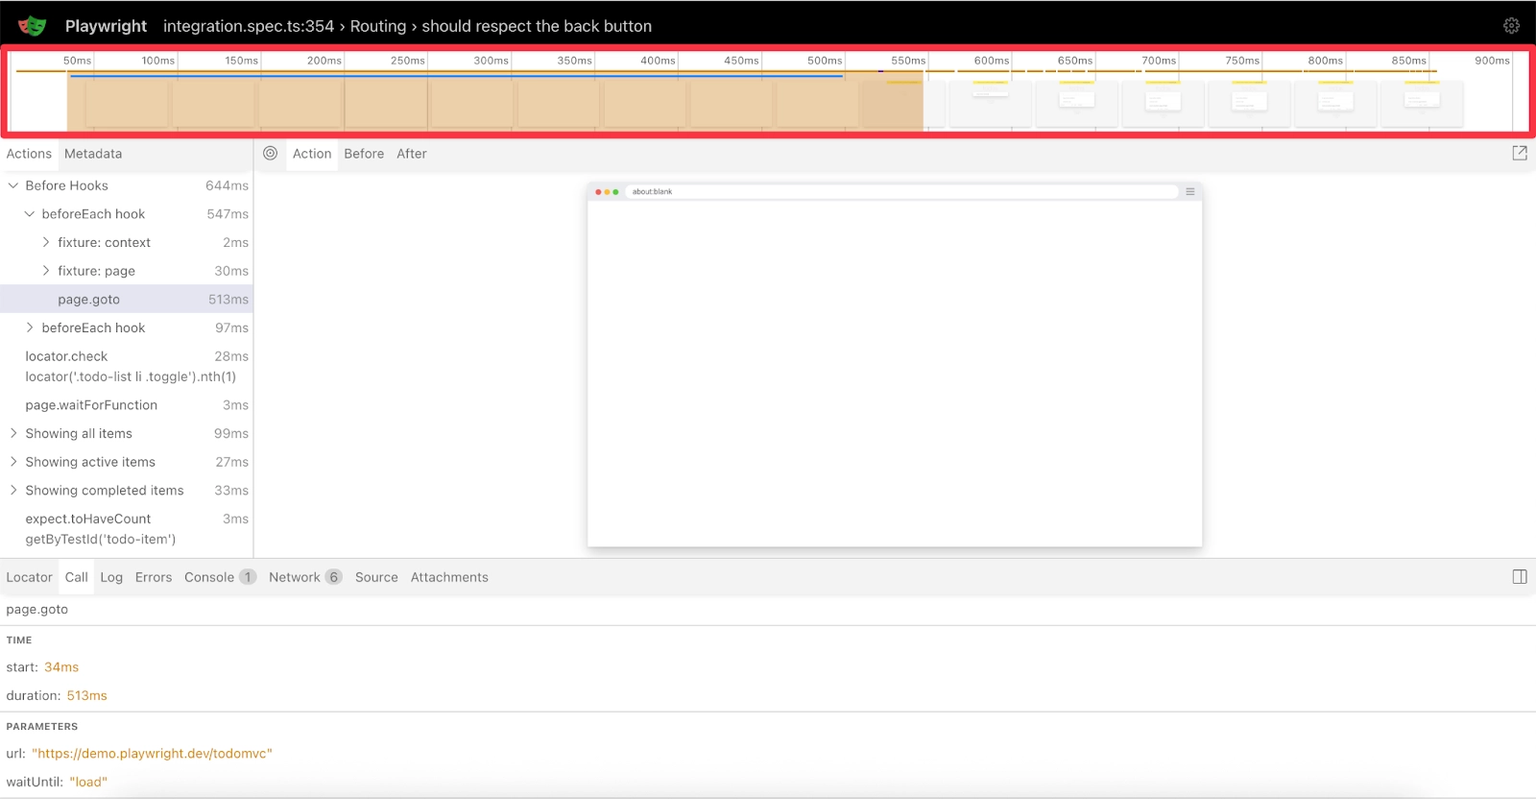
The timeline makes performance issues impossible to miss. That massive bar eating up the first 613ms? That's your setup time before anything is loaded. Dead air for users. The actual test actions cluster together afterward, looking tiny in comparison. No overlapping bars means everything runs sequentially, which is another optimization opportunity.

Those small gaps between actions? That's Playwright's auto-waiting in action, ensuring elements are ready before interacting with them.
The DOM Time Machine
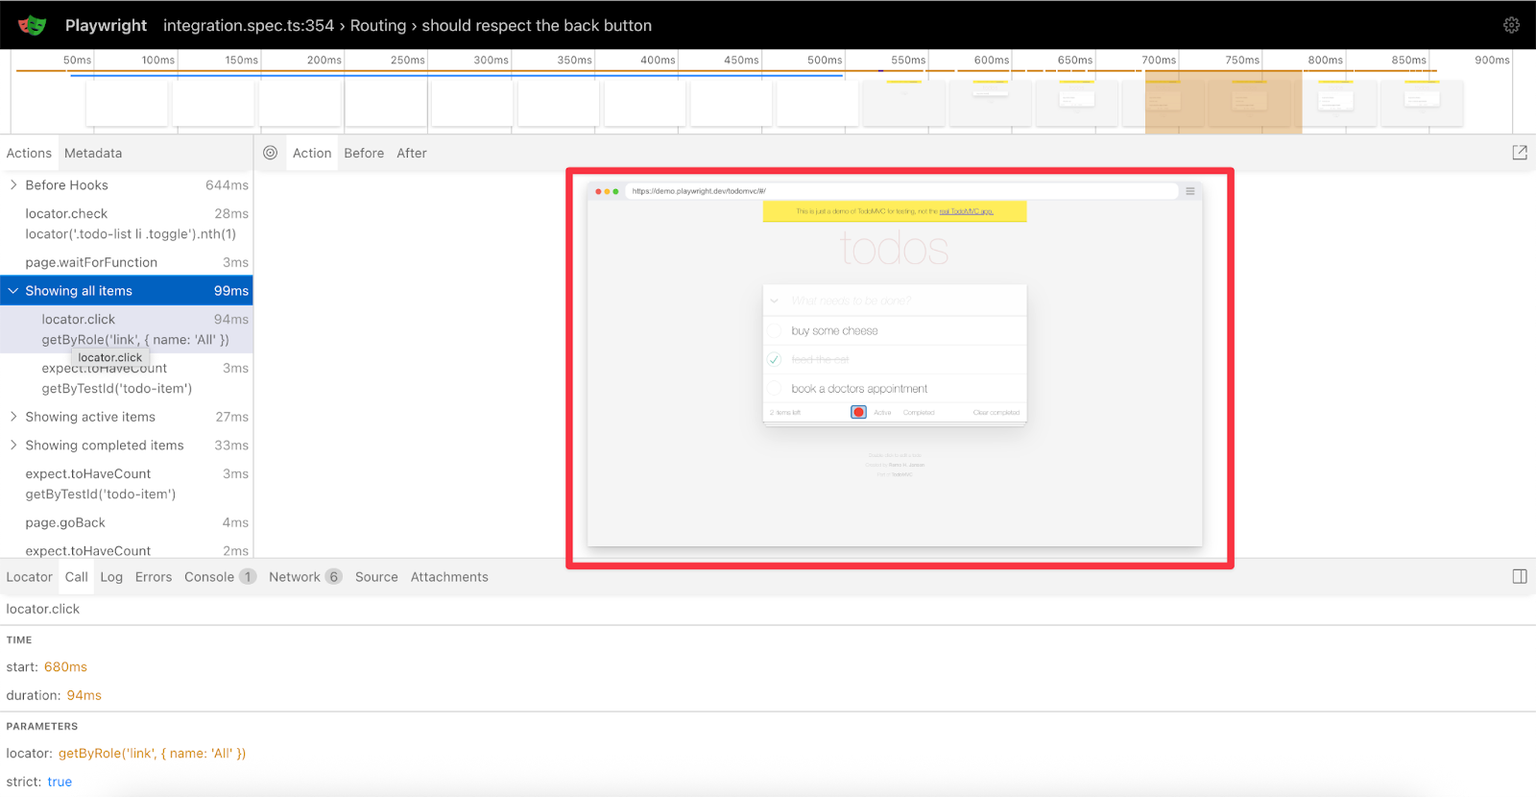
The center panel is an interactive DOM snapshot. Our TODO app shows three items: "buy some cheese", "feed the cat", and "book a doctors appointment".
Click "Before" - all checkboxes unchecked. Click "After" - "buy some cheese" is now checked. Hover over any element to see the exact selector Playwright would use, e.g., [data-testid="todo-item-1"].
This is invaluable for debugging. Element not found? The DOM snapshot shows you precisely what was there instead.
Understanding Playwright's Decision Process
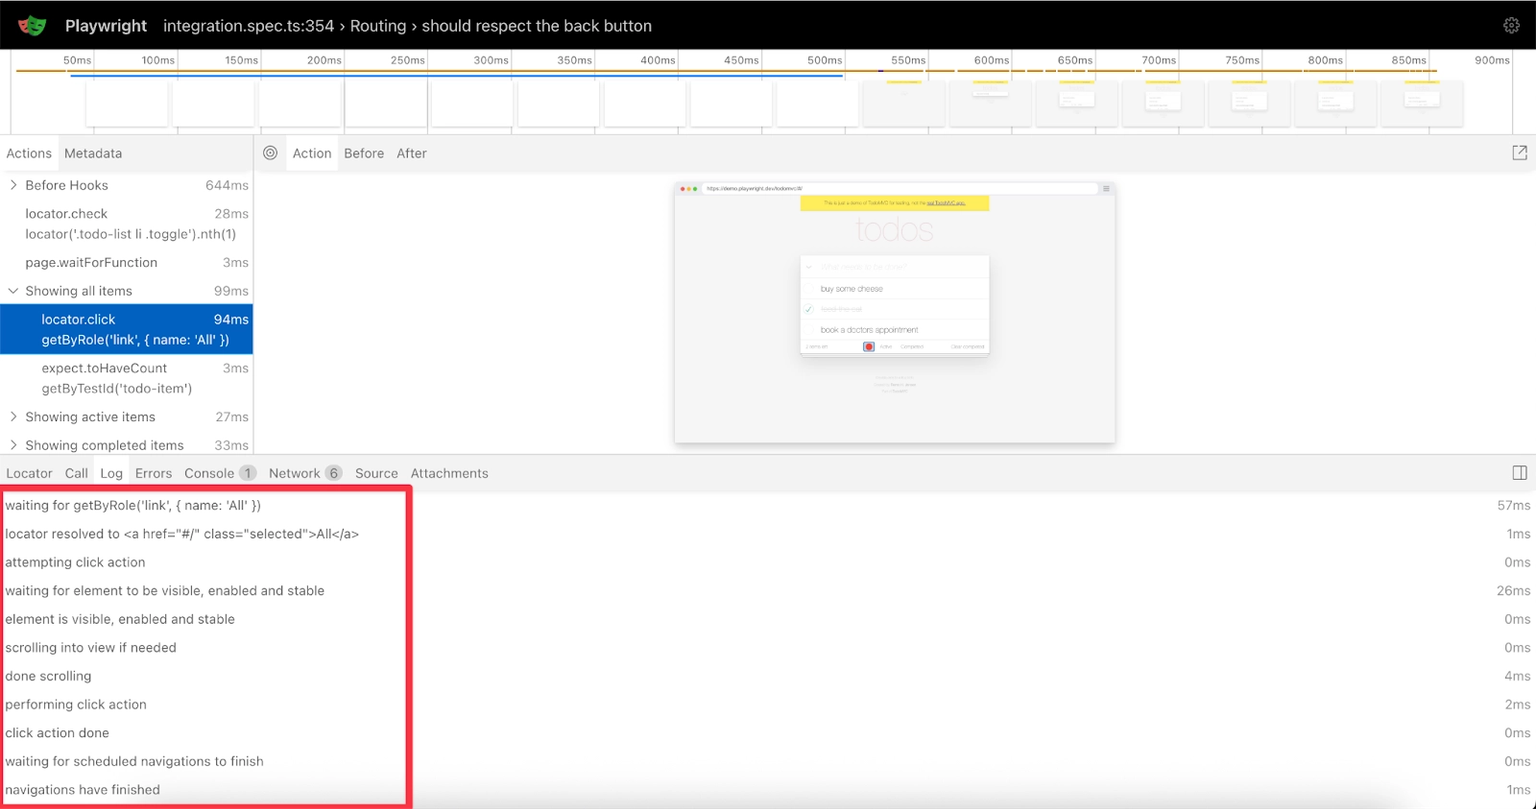
The logs tab reveals Playwright's thinking:
- waiting for getByRole('link', { name: 'All' })
- locator resolved to <a href="#/" class="selected">All</a>
- attempting click action
- waiting for element to be visible, enable, and stable
- element is visible, enabled and stable
- scrolling into view if needed
- done scrolling
- performing click action
- click action done
- waiting for scheduled navigations to finish
- navigations have finished
Eleven distinct checks explain why "Showing all items" took 94ms. This isn't slowness, it's Playwright being thorough.
Network Traffic Reveals Hidden Conversations
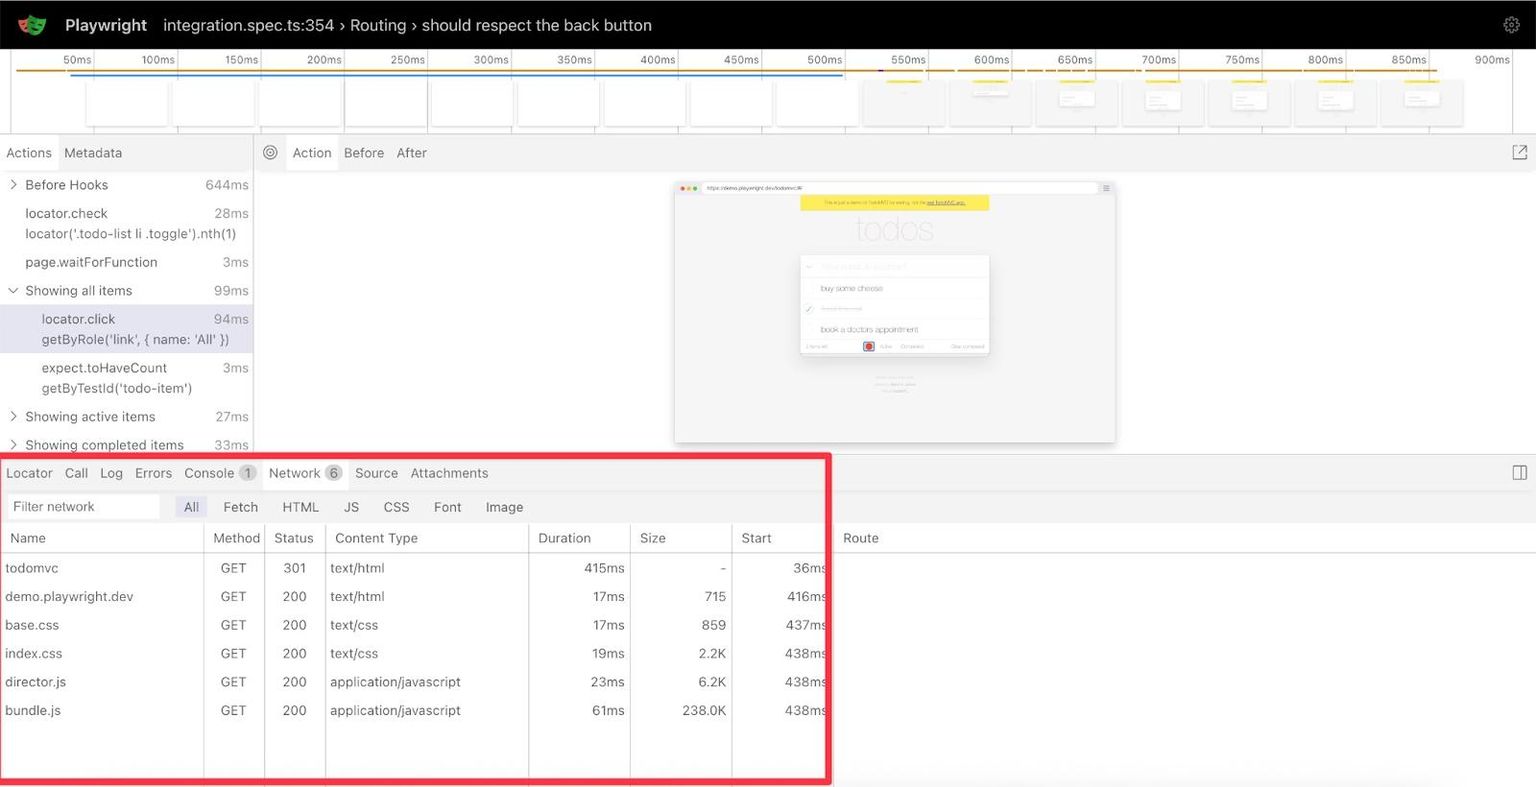
The Network tab's requests tell another story. You can see:
- Initial page loads (HTML, CSS, JavaScript)
- Any API calls for TODO operations
- Failed requests highlighted in red
Each request shows timing, size, and status. Click on any request to view the full headers and payloads.
Putting It All Together
Each panel tells part of the story. Actions show what your test did. Timeline reveals where time went. DOM proves the UI state. Logs explain Playwright's waits. Console captures app behavior. Network uncovers API interactions.
Combined, they give you insight into your test execution. That 644ms setup time? The TODO app initializing. The 99ms filter change? DOM updates and re-rendering.
This is the Trace Viewer's power: complete visibility into every aspect of your test.
How Do You Eliminate Flaky Tests with Traces?
Flaky tests waste more engineering time than any other testing problem. Traces provide the evidence needed to fix them systematically.
Capturing Both Success and Failure States
Run your flaky test multiple times until you capture both passing and failing traces:
Open a passing and failing trace in separate browser tabs. Focus on the moments just before divergence - often the last successful action before the failure.
Common Flakiness Patterns and Fixes
Race Condition with Network Requests
In the failing trace, you'll see the Network tab shows an API call completing after a UI interaction. In the passing trace, it completes before. The Metadata logs confirm Playwright clicked before data arrived.
Fix:
Element Not Stable
The Timeline shows longer durations for the same action between runs. The Metadata logs reveal multiple "element is not stable" messages before success. This indicates animation or dynamic positioning.
Fix:
Timing-Dependent State
The DOM snapshots show different initial states between runs. One trace starts with cached data visible, another with a loading spinner. Your test assumes consistent starting conditions.
Fix:
Traces show you precisely what differs between passing and failing runs. Instead of guessing, you see the precise moment and reason for divergence.
What Advanced Debugging Patterns Should You Know?
Binary Search for Long Tests
When a 5-minute test fails at an unknown point, use programmatic tracing to isolate the problem:
This generates a focused trace of just the failing section, keeping file sizes manageable and analysis targeted.
Performance Regression Detection
Traces aren't just for failures. Use them to catch performance degradation:
The Timeline immediately shows which actions grew slower. The Network tab often reveals new, unoptimized API calls. The Metadata logs may show an increase in retry attempts.
Debugging CI-Only Failures
When tests pass locally but fail in CI, the trace becomes your remote debugger. Common discoveries:
- Different viewport sizes: DOM snapshots show elements overlapping in CI's headless browser
- Missing environment variables: Network tab shows 401 errors from missing auth tokens
- Slower machines: Timeline shows timeouts that don't occur on fast developer machines
- Different browser versions: Console tab reveals JavaScript errors from unsupported features
Always configure CI to preserve traces for failed tests. The 30MB trace file saves hours of "works on my machine" debugging.
How Do You Integrate Traces with CI/CD?
GitHub Actions Configuration
Automated Failure Analysis
Create a simple reporter that processes failures and notifies your team:
Pull Request Integration
Add trace links directly to PR comments when tests fail:
This transforms your PR review process. Instead of vague "tests are failing" comments, reviewers gain direct access to traces that show exactly what broke.
Best Practices for Production Use
Storage Management
Trace file sizes vary widely depending on the app, assets, and configuration. Best practices:
- Use retain-on-failure in CI (only failed tests generate traces)
- Set retention limits: 7 days for feature branches, 30 days for main
- Exclude screenshots when debugging logic issues: { screenshot: 'off' }
- Archive important traces (production failures) to long-term storage
Team Adoption
Make traces part of your workflow:
- Bug Reports: Require trace files for all test failure reports
- Code Reviews: Check traces when reviewing test changes
- Debugging Sessions: Share traces in Slack instead of screenshots
- Post-Mortems: Use traces to understand cascade failures
The Playwright Trace Viewer transforms test debugging into knowledge - you no longer guess what happened - you see it, interact with it, and understand it completely.
Start with trace: 'retain-on-failure' today. When your next test fails, instead of adding console.log statements, open the trace. You'll find the root cause in minutes, not hours.
The investment in setting up proper tracing pays off immediately. Every mysterious failure becomes a learning opportunity. Every flaky test becomes fixable. Every "works on my machine" becomes "here's exactly what happened."
Master the Trace Viewer, and you master test debugging.